Table of Contents
Many people are investing in cryptocurrencies today. It's easy to see why—trading them can be a lucrative venture. However, analyzing market trends and making informed trading decisions can be overwhelming for new investors and traders.
Ranges and trend lines are essential tools for traders. By learning how to use them, you can identify critical price levels and market trends. While it's impossible to time the market, these tools can signal ideal times to buy or sell coins.
What are Trend Lines?
Trend lines and ranges are fundamental tools in technical analysis that help determine price patterns and investor sentiment in the crypto market. Trend lines in particular reveal the market's directional momentum - upward, downward, or sideways.
Ranges, on the other hand, occur when a market prices stay within established lines of support and resistance for an extended period. They're used to identify periods of market consolidation, signaling that investors are in equilibrium. Ranges provide consistent opportunities, with the upper and lower bounds acting as buy and sell signals respectively.
Trading with trend lines and ranges is the basis of technical analysis, allowing traders to make informed decisions about price action when buying and selling.
Why are Trend Lines Important?
Trend lines are used to gauge the strength of a trend and to predict potential areas of support or resistance, which traders can use for their entry and exit points in their trades. While not always perfect in predicting a coin's price, there are behavioral and historical patterns behind them that validate their usefulness, and far outweigh buying and selling at random.
Ranges refer to the consolidation area or trading range between a support level (the lowest price at which buyers are willing to buy) and a resistance level (the highest price at which sellers are willing to sell). A coin's price moves sideways between these two levels, creating a range.

Trend lines are lines that connect two or more price points, indicating the market trend's direction. They can either be uptrends (indicating bullish sentiment) or downtrends (indicating bearish sentiment).
Ranges and trend lines provide us with vital information about the market sentiment and key price levels. By identifying these levels, traders know when to buy, sell, or hold positions.
How to Draw Trend Lines and Ranges Correctly
By now, you should have a basic understanding of why ranges and trend lines are important. Let's explore how to trade cryptocurrencies with them!
1. Identify Key Support and Resistance Levels
The first step to trading crypto with trend lines and ranges is identifying key support and resistance levels. These are the price levels at which buyers and sellers are most active, creating a range between them.

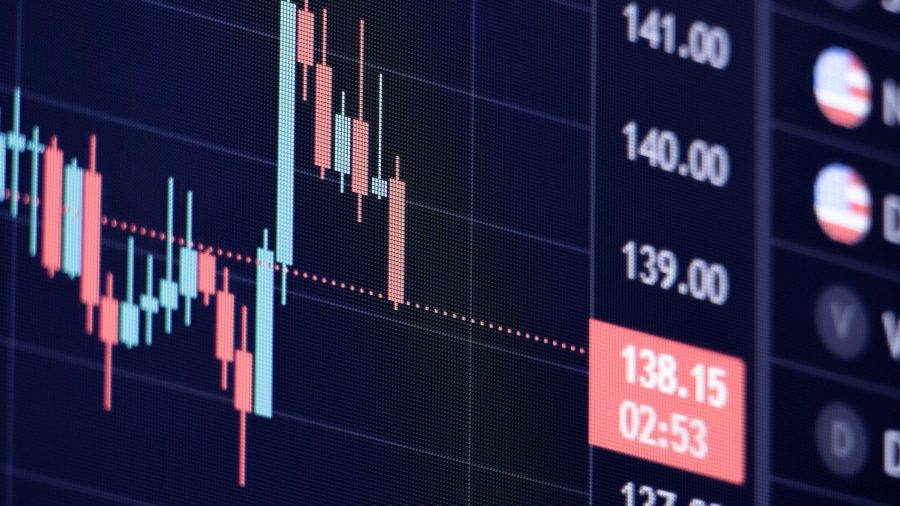
Identify these levels by using technical analysis tools like charts and indicators. For example, a line chart can help you indicate levels at which the price has bounced off multiple times. This indicates strong support or resistance levels.
2. Draw Trend Lines to Identify Market Trends
Once you've identified key support and resistance levels, it's time to draw trend lines. By trading with trend lines you can determine whether the market is bullish or bearish.

To draw one, connect two or more price points using a straight line. For instance, if the price has been going up, connect the lows to create an uptrend line. If the price has been going down, connect the highs to create a downtrend line.
3. Use Ranges and Trend Lines to Spot Trading Opportunities
After identifying key support and resistance levels and drawing trend lines, use this information to spot trading opportunities.

Is the price approaching a resistance level and showing a bearish trend? It might be a good idea to sell your position before it gets bloody.
Is the price approaching a support level and showing a bullish trend? It may be a prime time to buy your position and take profits as it goes up.

Remember that ranges and trend lines aren't foolproof indicators, though. Traders should use fundamental analysis and other technical analysis tools to make solid trading decisions.
Spotting Trend Reversals with Trend Lines
Identifying potential trend reversals is a key aspect of trading with trend lines and can provide you with a significant trading advantage. Start by connecting the highest peaks in a downtrend or the lowest troughs in an uptrend. These lines of resistance (in a downtrend) or support (in an uptrend) can serve as critical signals of potential market shifts. When prices penetrate these lines, it often presages a reversal.
This detection is pivotal because capturing a trend reversal can substantially maximize profits. For instance, if you spot a reversal in a downtrend, entering a long position at the lower end can help you ride the entire wave up. Similarly, identifying a reversal in an uptrend and going short can enable you to profit from a full downward wave. This approach is a crucial part of 'trend following', a strategy many successful traders use.
How to Use Trend Lines with Indicators
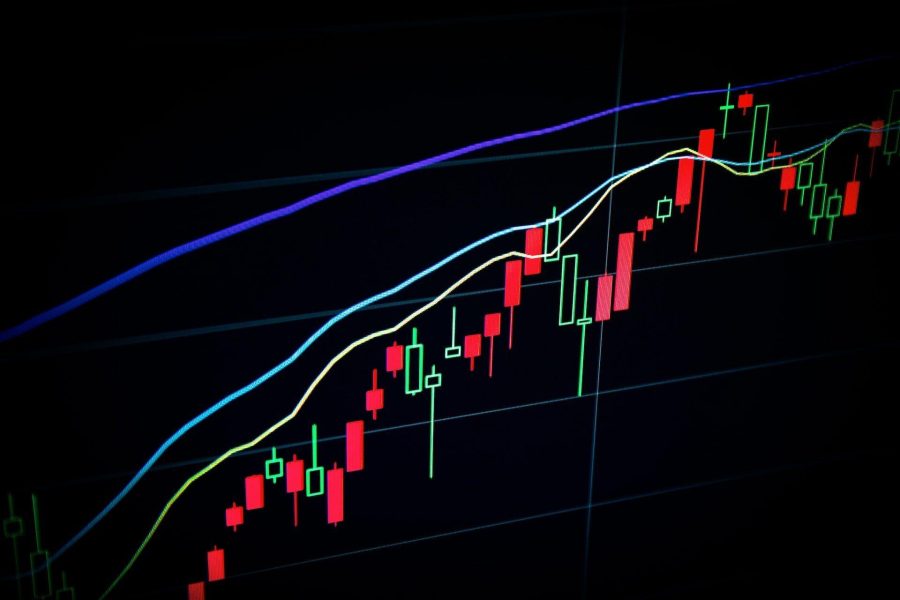
Integrating trend lines and ranges with indicators such as the Relative Strength Index (RSI) or Moving Averages can dramatically enhance your trading outcomes. Here's a practical example: If the price breaches a trend line, simultaneously observe the RSI. If it's above 70 (overbought) or below 30 (oversold), it might indicate a strong reversal.
Similarly, in a ranging market, a moving average can provide additional confirmation. If the price is bouncing off the lower range and a moving average line lies above, the price might get a double resistance making it a stronger signal. These techniques, when used together, can provide multiple layers of confirmation, increasing the likelihood of successful trades.
Utilizing the Trendline Breakout Strategy
The breakout strategy involves monitoring a defined range or a trend line closely and entering the trade when the price decisively breaks out. The real key to this strategy is not just the breakout but the volume accompanying it. A breakout on high volume suggests strong investor interest, reinforcing the potential for a sustained trend.
Let's say, for instance, Bitcoin has been trading between $30,000 and $40,000 for several weeks. If the price suddenly breaks above $40,000 on high trading volume, this could be an excellent opportunity to enter a long position, betting on the start of a new uptrend. This well-timed entry point can maximize profits and reduce downside risk, demonstrating the breakout strategy's value in trading.
Increase Profitability with Trend Lines by Analyzing Charts
Trading with trend lines and ranges is a powerful trading strategy. It can help you identify market trends and make calculated trading decisions. Seasoned traders and investors constantly study charts, along with past market data and volume, in attempt to predict future price movements in a market. This involves various forms of chart analysis, including line charts, bar charts, and candlestick charts, to visualize historical data and recognize patterns. The fundamental principle behind chart analysis is that market behavior tends to repeat itself. By identifying these patterns, traders can make informed decisions about when to buy and sell.
Timeframe analysis can also significantly increase your chances of profitability as well. By analyzing charts on different timeframes - from weekly and daily to hourly or minutes - you can gain a broader perspective of the market trend, confirm your trading signals, and identify key levels more accurately. This tactic helps to validate your trades and prevent potential misinterpretation of market signals based on a single timeframe. Remember, the more confluence you have before entering a trade, the higher your probability of success.
But still, crypto trading doesn't come without risk. Always use proper risk management and conduct thorough analysis before buying or selling assets.
Learn the Best Trading Techniques With ARCollective
Are you interested in not only trading with trend lines, but becoming a seasoned crypto investor and trader? Connect with 1,500+ traders at ARCollective! We offer educational resources, live streams, and support in your investing journey. Our exclusive online courses teach cutting-edge trading strategies and methods for growing your crypto portfolio. Take your trading game to the next level by exploring our membership tiers today!